Custom monitoring
ElasTest automatically gathers metrics and logs from all TJobs and from all SuTs deployed by the platform itself (dockerized SuTs), as explained here. And ElasTest allows configuring already deployed SuTs for sending metrics and logs thanks to Beats technology, as explained here. But what if you want to send some custom information to ElasTest to be shown or graphed during a TJob execution? For example:
- If your SuT is a web application, the code in your TJob can send the number of users connecting to it as it executes so you can compare it with the CPU consumption or memory usage of the SuT.
- If you are interested in a specific metric of your SuT for which there's no Beat agent available (official agents or community agents), you can always send it through http.
For this reason, ElasTest allows users to send any log or metric through http requests.
Send metrics with HTTP
You can send to ElasTest metric information with http requests from any TJob or any SuT.
IP of http request in a TJob or a SuT deployed by ElasTest
Value of environment variable ET_MON_LSHTTP_API.
IP of http request in a SuT deployed outside ElasTest
The URL can be built with HTTP Api Url param, available from the SuT information page:
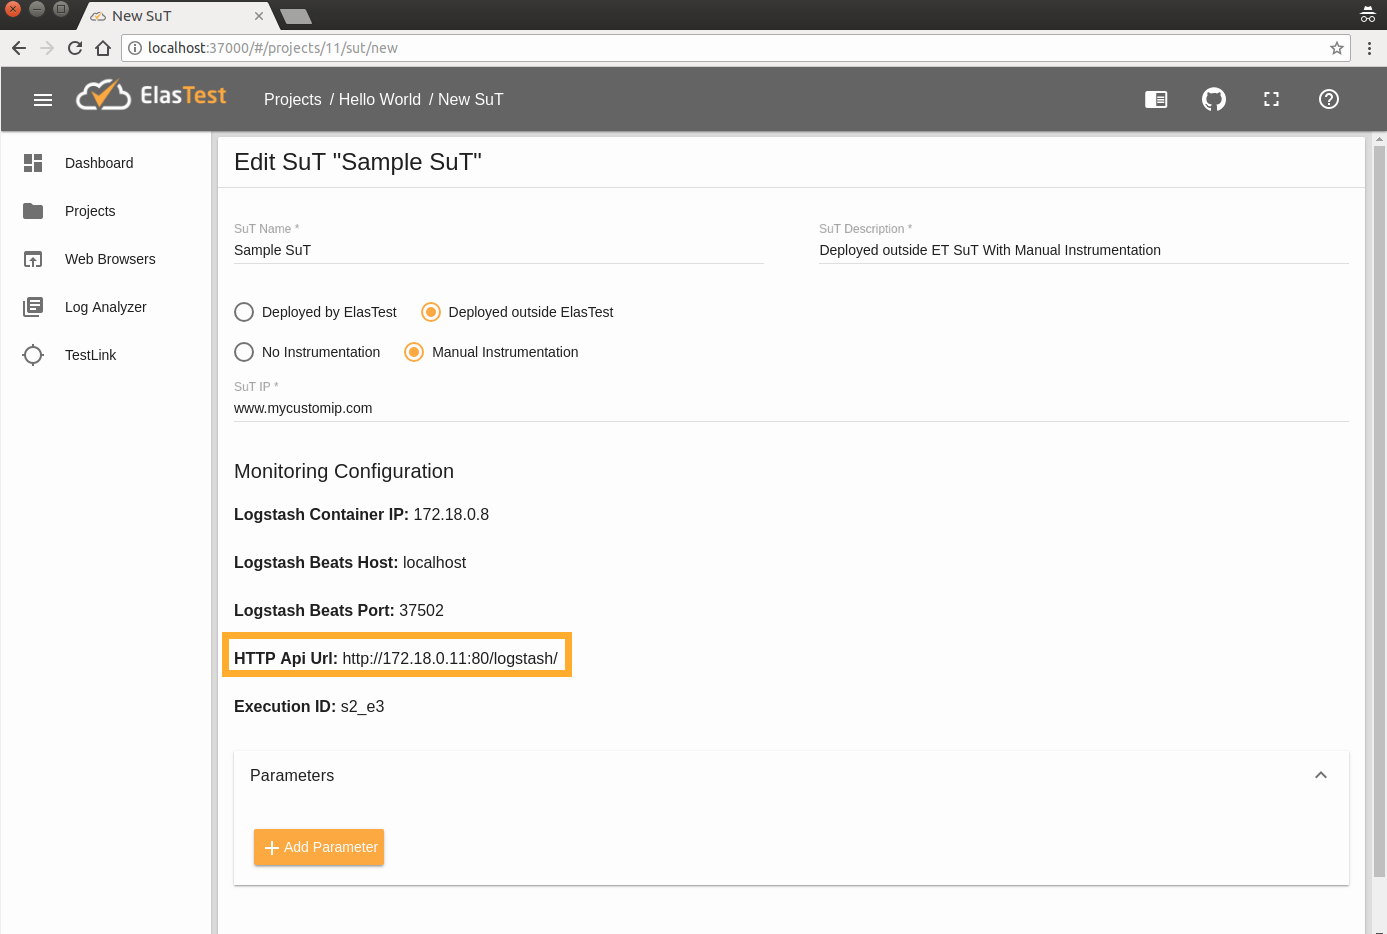
For to the image above, the URL where to send the post requests would be:
http://172.18.0.11:80/logstash/
The request has to use the POST method. There are different formats to send different types of information:
Send one log entry in one request
{
   "@timestamp": 9999999999,
   "exec": "XX",
   "component": "YY",
   "stream": "ZZ",
   "message": "Complete log message entry"
}
- @timestamp: is optional and contains the timestamp when event was generated.
- exec: The value of Exec ID shown in ElasTest dashboard for SuTs deployed outside ElasTest or the value of
ET_MON_EXECenvironment variable for TJobs or SuTs deployed by ElasTest. - component:
sutfor http requests sent from the SuT andtestfor http requests sent from the TJob. - stream: Used to distinguish several logs from the same component. In this case only one log exists for the component, its value is usually "default_log".
- message: Complete log message entry.
Send several log entries in one request
{
   "@timestamp": 9999999999,
   "exec": "XX",
   "component": "YY",
   "stream": "ZZ",
   "messages": [
      "Complete log message entry 1",
      "Complete log message entry 2",
      "Complete log message entry 3",
      "Complete log message entry 4"
   ]
}
Send one atomic metric in one request
{
   "@timestamp": 9999999999,
   "exec": "XX",
   "component": "YY",
   "stream": "cpu_usage",
   "stream_type": "atomic_metric",
   "cpu_usage": 80,
   "unit": "%"
}
- stream field can be whatever you want (it has to be used below when setting the numeric value)
Send one composed metric in one request
{
   "@timestamp": 9999999999,
   "exec": "XX",
   "component": "YY",
   "et_type": "cpu",
   "stream_type": "composed_metric",
   "cpu": {
     "total_usage": 80,
     "max_usage": 100
   }
   "units": {
     "total_usage": "%",
     "max_usage": "%"
   }
}