Monitoring outside ElasTest
When ElasTest is executing tests against an already deployed SuT, it is necessary to explicitly gather monitoring information from it if we want to benefit from ElasTest monitoring and analysis features. The required instrumentation can be done in two different ways:
- Automated instrumentation: If the SuT is a linux box with ssh access, ElasTest will be able to instrument it automatically. (Feature coming soon)
- Manual instrumentation: The SuT admin may install itself the instrumentation agents or configure the platform to send monitoring information to ElasTest.
Manual instrumentation
Manual instrumentation can be done by:
-
Using Beats technology: Beats is a platform for single-purpose data shippers created to work with Logstash and ElasticSearch. There are a lot of beats agents to collect monitoring information from all kinds of sources. For example: Filebeat, Metricbeat or Packetbeat. If you can't find a certain beat agent among the official ones, you can always search beats bult by the community or create your own beat.
-
Sending metrics with http POST requests: If beats agents doesn’t suit your needs, you can always send monitoring information with http requests. Check out section Custom monitoring to learn how.
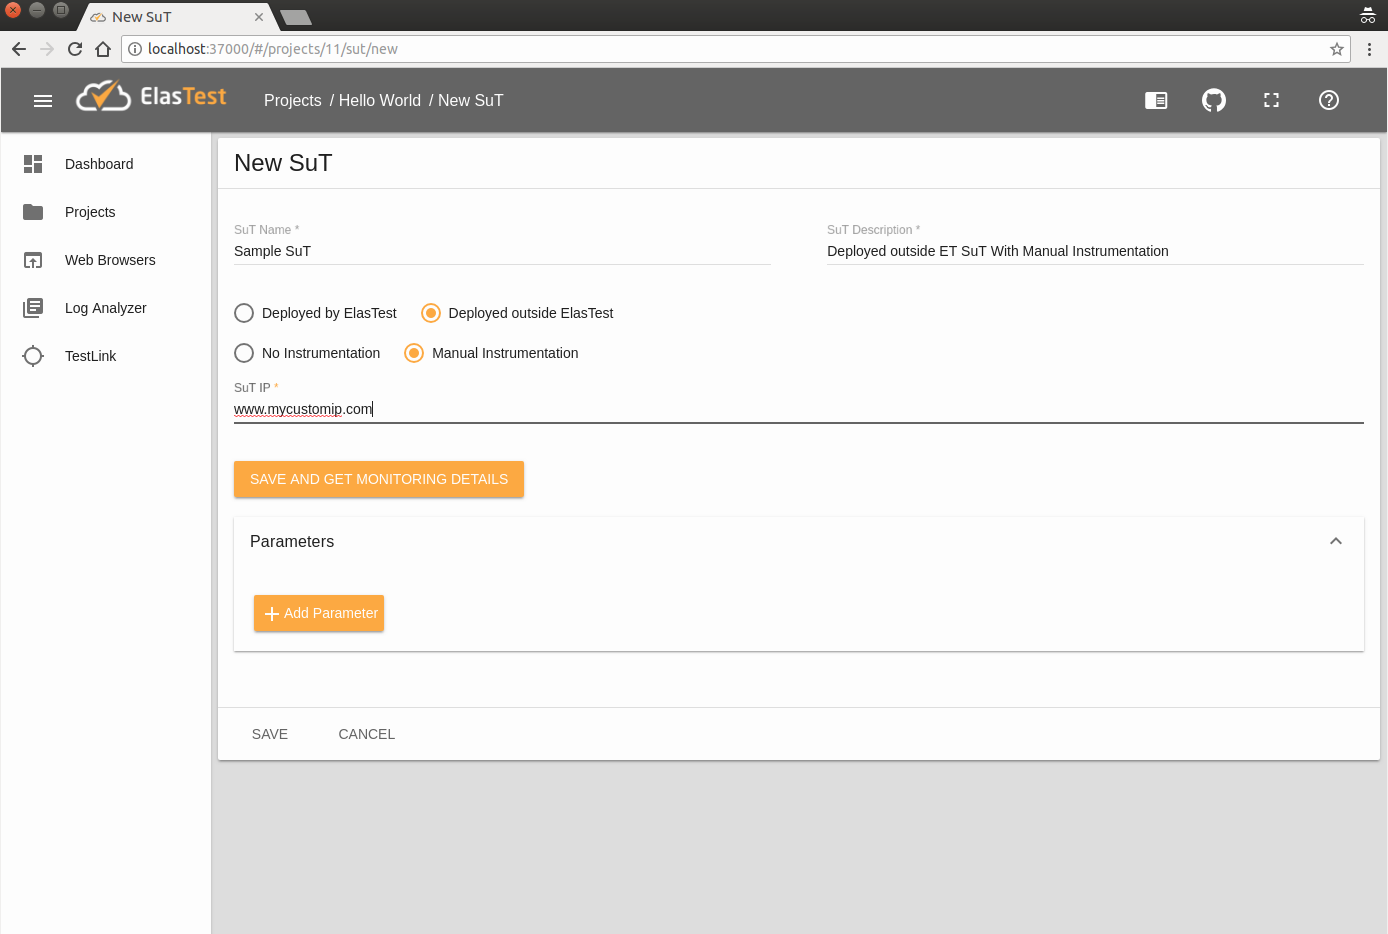
To create a SuT ready to be manually instrumented, fill the form as shown in the image below on "New SuT" page:
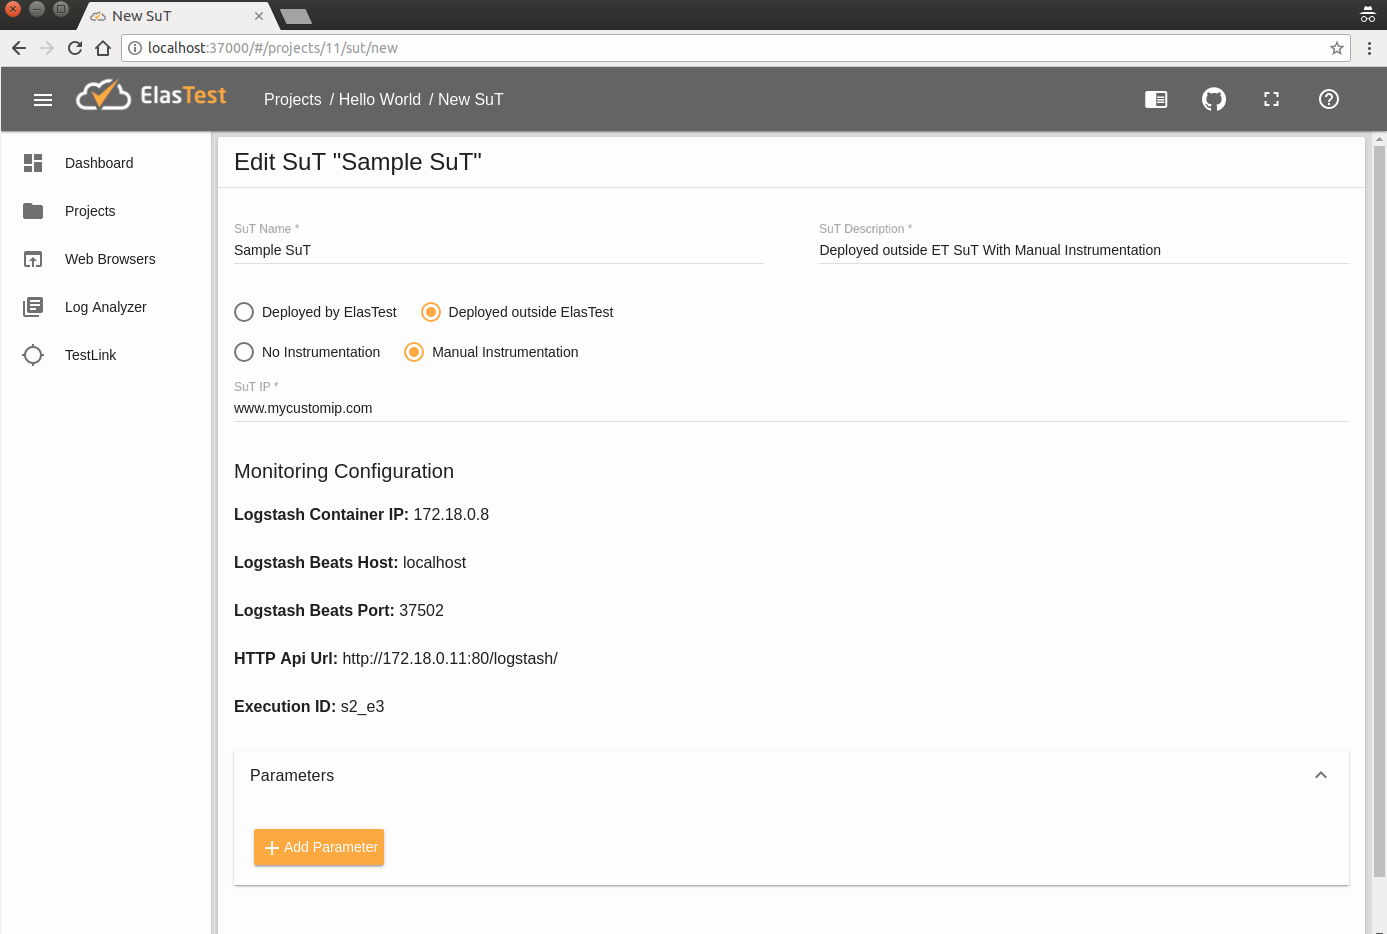
Once you click on Save and get monitoring details button, the following configuration parameters will be shown:
- Logstash Container IP: The Logstash Container IP.
- Logstash Beats Host: The public host (IP or FQDN) in which Logstash is located for send Beats traces (along with the Beats Port).
- Logstash Beats Port: The port in which Logstash can receive beats monitoring information.
- HTTP Api Url: The complete URL for send http requests to Logstash with monitoring information.
- Execution ID: The execution identification value that has to be included in events sent to Logstash. This value is used to identify what events belongs to this SuT.
We will be using them in the following section.
Send metrics with Beats
As ElasTest already includes the required packages for using Beats (Logstash and ElasticSearch), you will only have to follow the official documentation for installing and configuring beat agents inside your deployed SuT.
To illustrate this process, let's see a pretty common use case: you have an app deployed somewhere in the cloud, and you want to run a TJob in ElasTest to test some feature of it. And you also want ElasTest to monitor certain log that your app produces on some custom path and the CPU usage on your server.
Monitor custom log in my server thanks to Filebeat
1. Create a new SuT
First of all, create a new SuT inside any Project in your ElasTest dashboard. Do it with Deployed SuT and Instrumented by SuT Admin options, just as shown in the images above.
2. Install Filebeat on your SuT machine
Let's suppose we have an Ubuntu machine hosting our app. We connect to it through ssh and run the command that Step 1 of Filebeat documentation tells us. In this case, by using Debian packages:
curl -L -O https://artifacts.elastic.co/downloads/beats/filebeat/filebeat-6.1.0-amd64.deb
sudo dpkg -i filebeat-6.1.0-amd64.deb
3. Configure Filebeat agent to suit your needs
Take a look to Step 2 of Filebeat documentation. In our machine the Filebeat configuration file is /etc/filebeat/filebeat.yml. The predefined default value for Filebeat is to gather all logs inside "/var/log/" folder:
Filebeat 6.2 version or lower
filebeat.prospectors:
- type: log
  enabled: true
  paths:
    - /var/log/*.log
Filebeat 6.3 version or higher
filebeat.inputs:
- type: log
  enabled: true
  paths:
    - /var/log/*.log
4. Configure Filebeat agent to connect to ElasTest
Again, just need to take a quick look to Step 3 of Filebeat documentation.
Our brand new agent has to be configured to send information to the Logstash instance of ElasTest. Logstash Host and beats port have to be used in Filebeat configuration file (again /etc/filebeat/filebeat.yml):
#----------------------------- Logstash output --------------------------------
output.logstash:
  hosts: ["127.0.0.1:5044"]
Where 127.0.0.1 has to be changed to the value of Logstash Beats Host and 5044 to the value of Logstash Beats Port. To include the Exec ID value, it is necessary to add custom fields in config file. Those fields are:
fields_under_root: true
fields:
  exec: XX
  component: YY
  stream: ZZ
The value of the fields are:
- exec: The value of Exec ID shown in ElasTest dashboard when SuT is created.
- component:
sut - stream: The name of the event stream. For example:
my_custom_log
So the final look of filebeat.yml in its simplest form is:
Filebeat 6.2 version or lower
#====== "filebeat.yml" to send to ElasTest the logs generated on "/path/to/MY_CUSTOM_LOG.log" ======
filebeat.prospectors:
- type: log
  enabled: true
  paths:
    - /path/to/MY_CUSTOM_LOG.log

output.logstash:
hosts: ["LOGSTASH_IP:LOGSTASH_BEATS_PORT"]

fields_under_root: true
fields:
exec: XX
component: sut
stream: YY
Filebeat 6.3 version or higher
#====== "filebeat.yml" to send to ElasTest the logs generated on "/path/to/MY_CUSTOM_LOG.log" ======
filebeat.inputs:
- type: log
  enabled: true
  paths:
    - /path/to/MY_CUSTOM_LOG.log
  fields_under_root: true
  fields:
    exec: XX
    component: sut
    stream: YY

output.logstash:
  hosts: ["LOGSTASH_IP:LOGSTASH_BEATS_PORT"]
Whenever you are happy with your Filebeat configuration, run the service:
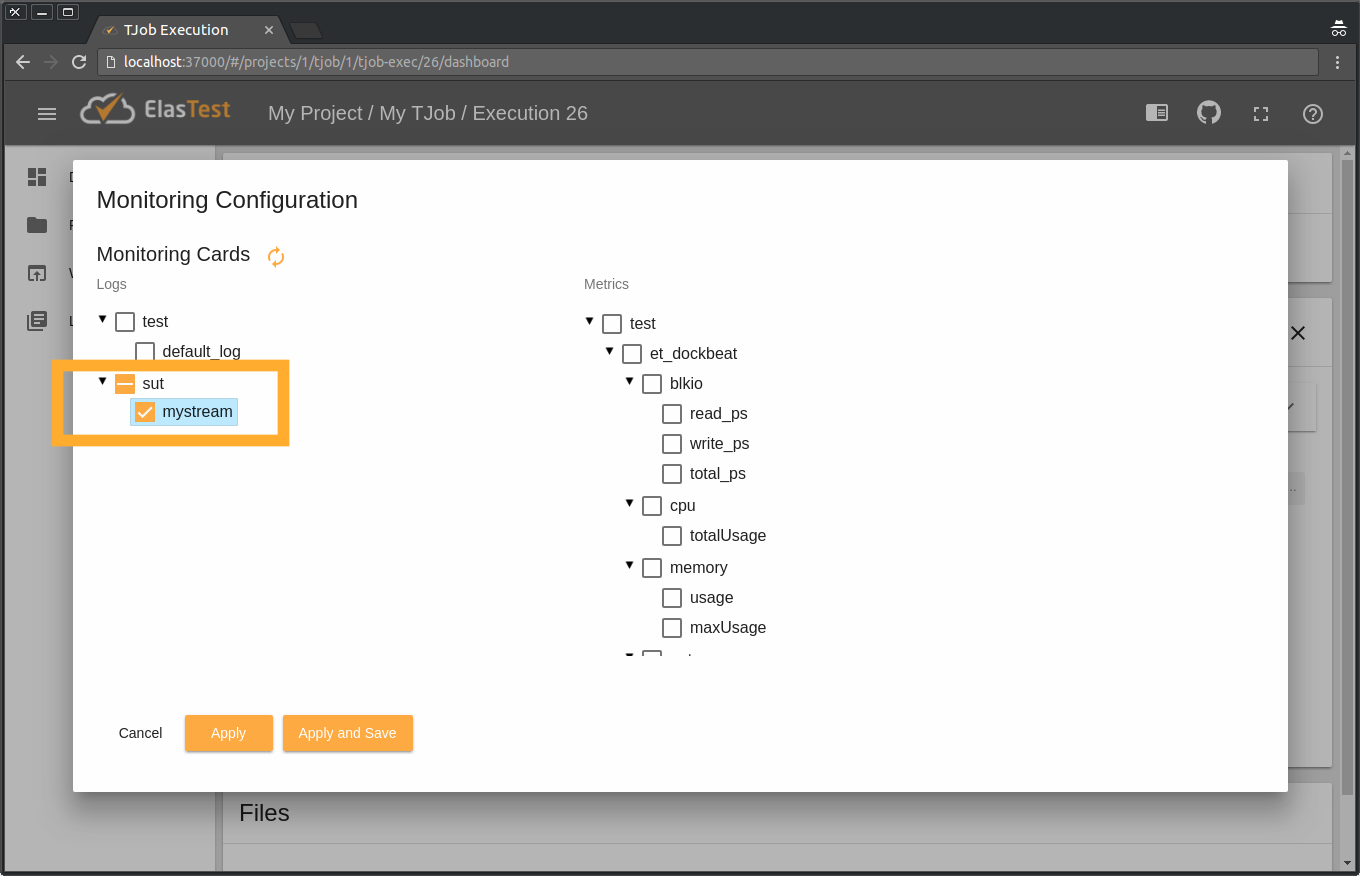
service filebeat startAnd that's all. You can now see on ElasTest dashboard these remote logs when running your TJob. To do so click on Monitoring Configuration button:

And select your new log stream. Here it is called mystream, because that's the name we gave it in "filebeat.yml" file on our server.
Monitor a custom metric in my server thanks to Metricbeat
1. Create a new SuT
First of all, create a new SuT inside any Project in your ElasTest dashboard. Do it with Deployed SuT and Instrumented by SuT Admin options, just as shown in the images above.
2. Install Metricbeat on your SuT machine
Let's suppose we have an Ubuntu machine hosting our app. We connect to it through ssh and run the command that Step 1 of Metricbeat documentation tells us. In this case, by using Debian packages:
curl -L -O https://artifacts.elastic.co/downloads/beats/metricbeat/metricbeat-6.1.0-amd64.deb
sudo dpkg -i metricbeat-6.1.0-amd64.deb
3. Configure Metricbeat agent to suit your needs
Take a look to Step 2 of Metricbeat documentation. In our machine the Metricbeat configuration file is /etc/metricbeat/metricbeat.yml. According to Metricbeat docs, we could configure it like this:
metricbeat.modules:
- module: system
  metricsets:
    - cpu
  enabled: true
  period: 1s
  processes: ['.*']
  cpu_ticks: false
Take a look to the full list of metrics you can send with Metricbeat. Just add all the "metricsets" fields you want inside the proper "module" filed (for example, in module: system you could send - memory or - network appart from - cpu
4. Configure Metricbeat agent to connect to ElasTest
Again, just need to take a quick look to Step 3 of Metricbeat documentation.
Our brand new agent has to be configured to send information to the Logstash instance of ElasTest. Logstash Host and beats port have to be used in Metricbeat configuration file (again /etc/metricbeat/metricbeat.yml):
#----------------------------- Logstash output --------------------------------
output.logstash:
  hosts: ["127.0.0.1:5044"]
Where 127.0.0.1 has to be changed to the value of Logstash Beats Host and 5044 to the value of Logstash Beats Port. To include the Exec ID value, it is necessary to add custom fields in config file. Those fields are:
fields_under_root: true
fields:
  exec: XX
  component: YY
  stream: ZZ
  stream_type: WW
The value of the fields are:
- exec: The value of Exec ID shown in ElasTest dashboard when SuT is created.
- component:
sut - stream: The name of the event stream. For example:
my_custom_metrics - stream_type:
composed_metrics
So the final look of metricbeat.yml in its simplest form is:
#====== "metricbeat.yml" to send to ElasTest the cpu usage of our server ======

metricbeat.modules:

-   module: system
    metricsets:
    -   cpu
        enabled: true
        period: 1s
        processes: ['.*']
        cpu_ticks: false

output.logstash:
hosts: ["YOUR_SUT_IP:5044"]

fields_under_root: true
fields:
exec: XX
component: sut
stream: YY
stream_type: composed_metrics
Whenever you are happy with your Filebeat configuration, run the service:
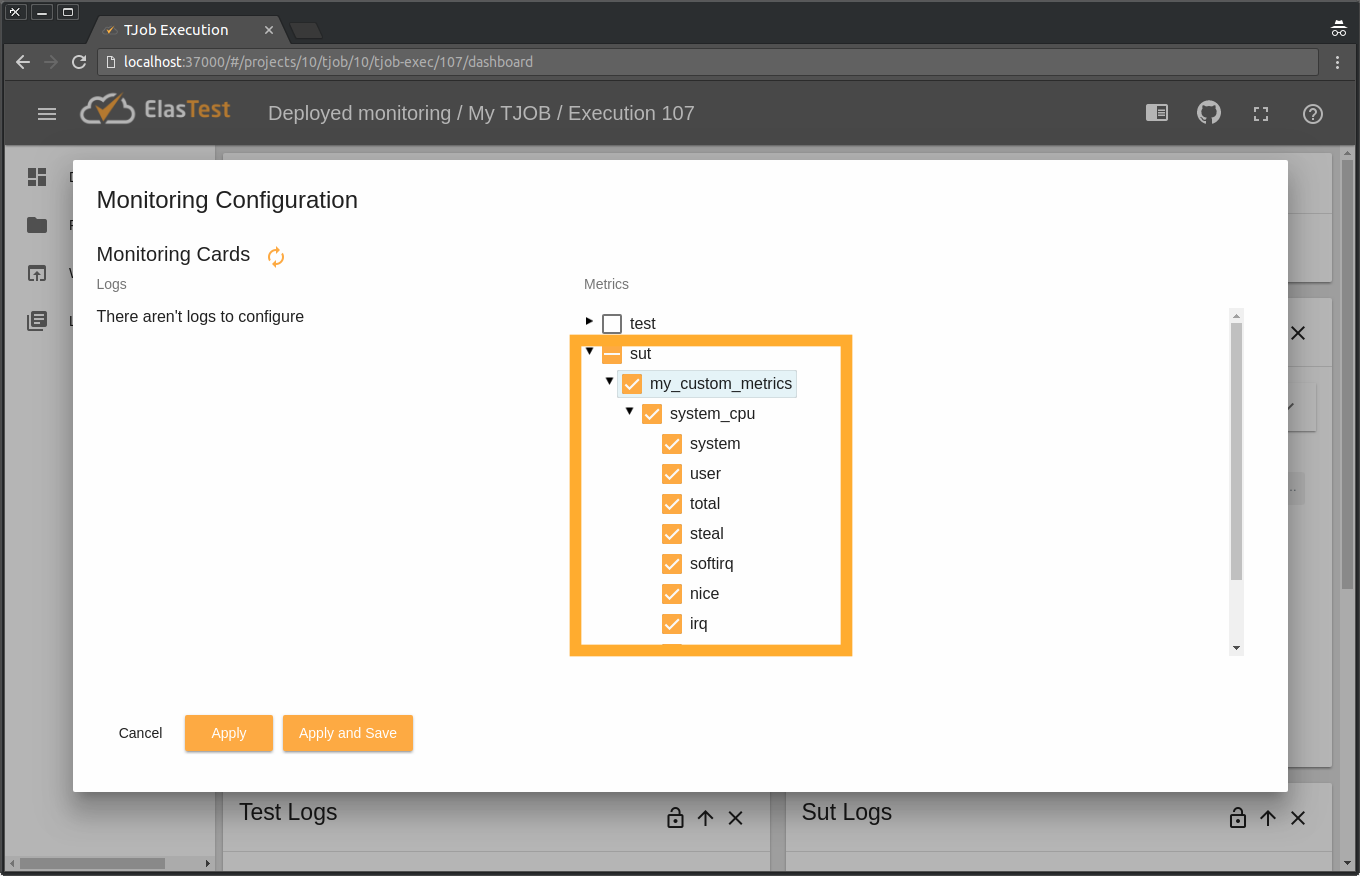
service metricbeat startAnd that's all. You can now see on ElasTest dashboard these remote metrics when running your TJob. To do so click on Monitoring Configuration button:
And select your new metric stream. Here it is called my_custom_metrics, because that's the name we gave it in "metricbeat.yml" file on our server. And it has as only child a node called system_cpu, since we only configured one "module" filed (system) with only one "metricsets" field (cpu). You can select the sub-metrics you want to be graphed, since for each metric Metricbeat sends varied information.