ElasTest Beta release
Patxi Gortázar (Universidad Rey Juan Carlos)

We are celebrating!! Before enjoying some relax and family time during Christmas holidays, on December 22nd we released our first public beta. This has been a major milestone in our roadmap. During November and December we have been demo’ing ElasTest at different events (Berlin 5G week, Valencia JUG, VLCTesting, Panel Sistemas 101 days, and Madrid JUG). This allowed us to solve some bugs and gain confidence that ElasTest was mature enough to enter public beta.
In parallel, we have been working hard on documenting every and each of the features provided, always taking into account our end-users. What follows is a description of the major features provided by ElasTest.
Use browsers with ease
So you are interested in UI testing through Selenium? But you’re unsure of how much infrastructure would you need or how long it will take to prepare the infrastructure, right? Just try out ElasTest and forget about installing and configuring testing tools for your selenium tests.
With ElasTest, using browsers is just one environment variable away from your code. We use the Selenium Remote Web Driver infrastructure to offer you, through a standard Remote Web Driver, any version of Firefox and Chrome browsers (with Windows IE and Edge coming next). Have a look at our docs to see how you can start using any number of browsers you want with minimum modification of your test code, and no infrastructure work at all.
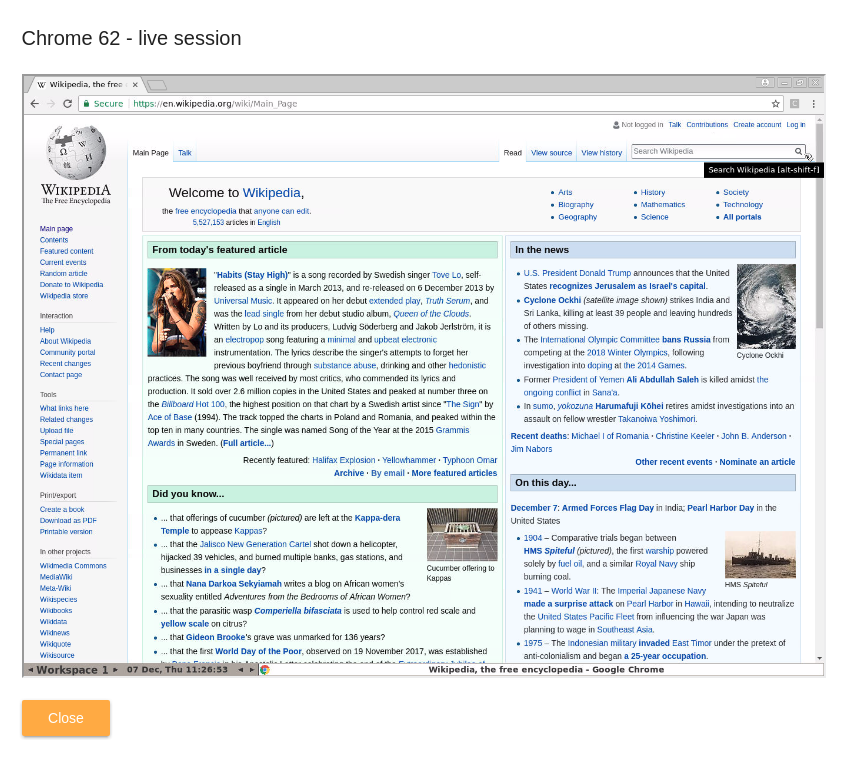
For manual testing, like in exploratory testing, it is even possible to launch browsers in the foreground and interact with the browser as if it was installed locally, but with the advantage of having browsers of different kinds and different versions at your fingertips. The browser is provided by ElasTest and the session is recorded automatically for you for later review.
Observability out-of-the-box
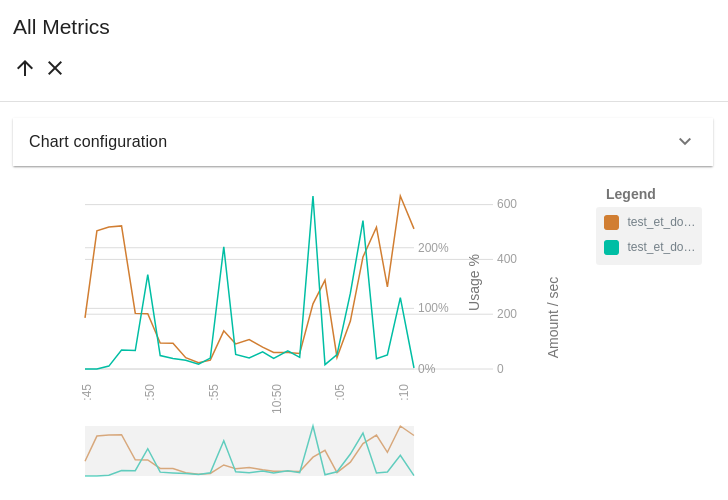
One of the key features of ElasTest is the ability to show and analyze logs and metrics of all elements involved in a test. This is particularly interesting for end-to-end (e2e) tests, which usually involve more complex system architectures in distributed environments. For example, suppose a typical three tier web application with a database. A basic e2e test has the following components: the test itself, web browser (or browsers!), web application and database. All those elements can generate logs and metrics of several types (CPU, memory, network packets, …). When a test is executed using ElasTest, the tester can see all that monitoring information in the same graphical user interface and with advanced analysis features. Come on, try it out following our instructions to run your first test in ElasTest.
The approach works with applications deployed by ElasTest, as shown here, but it works as well even when the application is deployed elsewhere, as documented here. You can even add your own metrics just by doing HTTP requests to ElasTest!!
Obviously, all the information gathered at runtime can be displayed offline, once the test has finished, by opening any previous execution of the test. Metrics will be loaded automatically and displayed for you for a closer inspection.
Find root causes for bugs faster
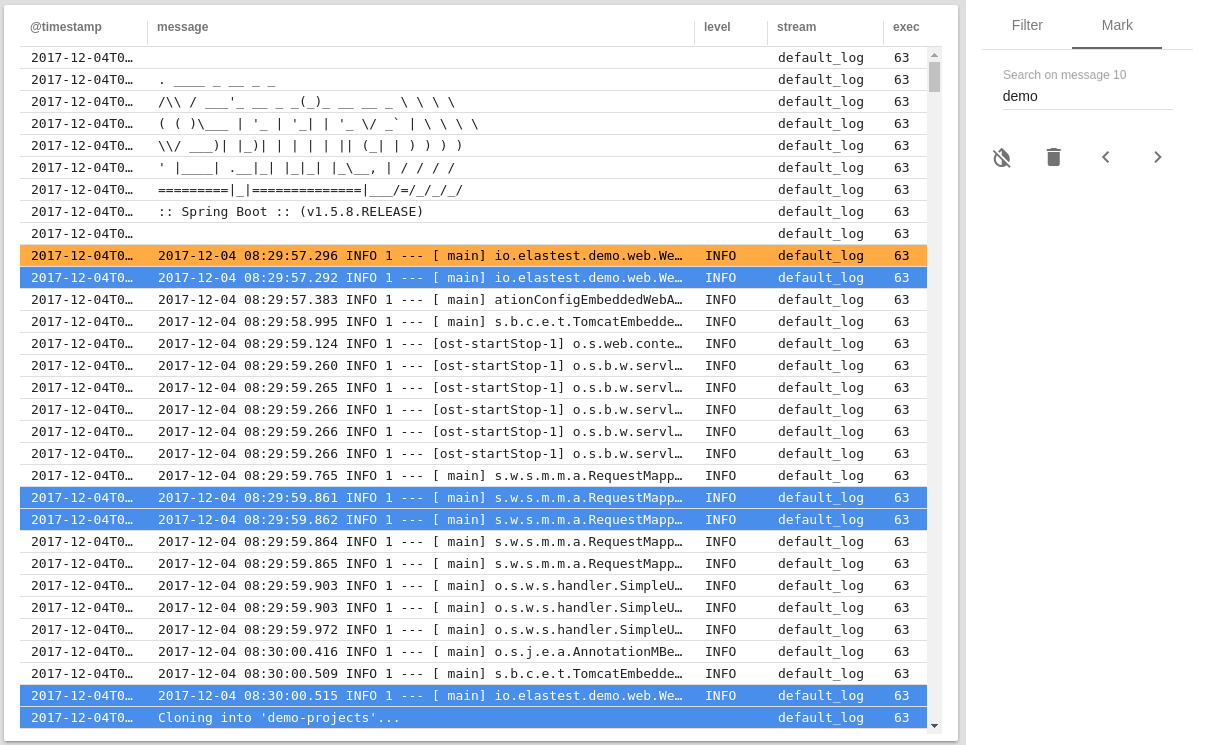
Gathering logs is only the first step. None of this would make sense if you couldn’t dive into your logs with a powerful, intuitive and adaptive tool as the ElasTest Log Analyzer. Leverage our log analyzer included in the platform to find the ultimate cause of your failing test cases.
The Log Analyzer includes two different features: a filtering tool that helps you filtering entries you want to focus on; and a marking tool that can mark using different colors, different entries. Both features work by providing a pattern that will be used to do the job. We find the marking tool a powerful feature that can help in focusing on specific entries, while at the same time avoiding hiding the context, as opposed to what it happens when some entries are filtered out. Further instructions can be found in Log Analyzer’s documentation.
As easy to deploy as we could make it
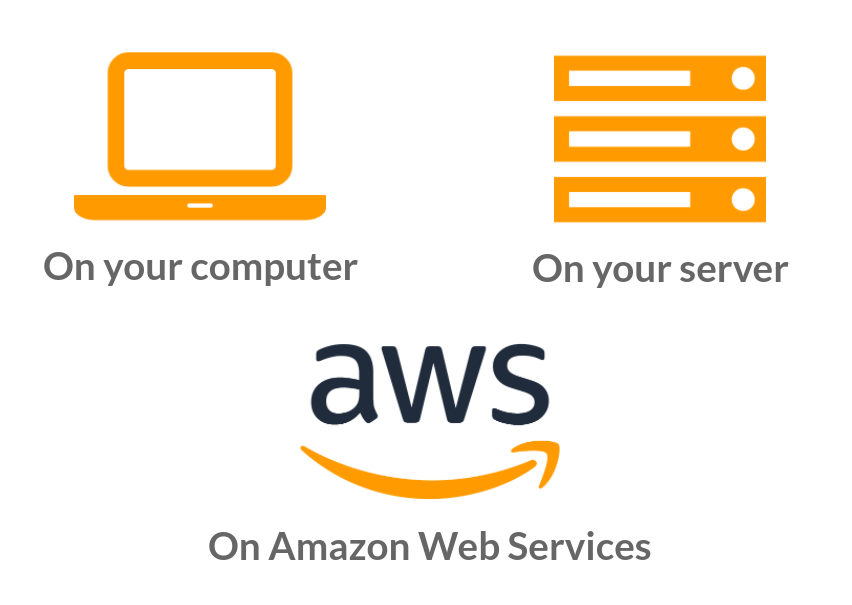
We wanted ElasTest to be easy to use, but easy to install and manage as well. We focused on the two easiest ways we found for deploying ElasTest: Docker and AWS CloudFormation. The former works by issuing a single Docker command, suitable for development machines using Linux, Mac and Windows, and Continuous Integration environments (big thanks to the people of Eclipse Che on which the single Docker command approach is based); the latter allows the deployment of ElasTest using AWS CloudFormation. Trying out ElasTest is just one click away.
By leveraging Docker technology, you can try ElasTest on any Linux and Mac, and on Windows (using both Docker Toolbox and Docker for Windows). Requirements? At least 8Gb of memory, and Docker installed. That’s all you need to give it a try!
See it in action!
Do you want to see it in action? The following video (in Spanish), recorded during our presentation in Madrid Java User’s Group, it’s a demonstration of ElasTest features to a diverse audience from the software industry (you can go forward to minute 37 when all the magic happens):
Contributing
If you try it out and you like it, you push the project forward (it’s open source in the end) by just subscribing to our user mailing list, starring our GitHub repository, tweeting around using the #ElasTest hashtag, or filling in any bugs you may found… if you’re able to find one ;)
Happy testing!!
The ElasTest team.